Analysis and Visualisation Software / BESA EEG/MEG Analysis
BESA EEG/MEG Analysis
Versatile and user friendly signal processing for EEG and MEG data. The most widely used software in EEG and MEG research, developed on the basis of 20 years experience in human brain mapping. Wide variety of source analysis algorithms. Bidirectional connection with BrainVoyager™ allows source seeding from fMRI clusters with one mouse click


Data Import and Export
- Direct readers for most EEG and MEG data file formats
- Import of user-defined file formats using generic reader
- Data import / export to ASCII and binary formats, e.g. MATLAB
Data Processing
- Superior digital filtering: high, low, and narrow band pass, notch
- Interpolation from recorded to virtual and source channels
- Automated EOG and EKG artifact detection and correction
- Advanced user defined instantaneous artifact correction
- Pattern detection and averaging by spatio-temporal correlation
- Linear and non-linear correlation between scalp and source channels
- Spectral analysis: FFT, DSA, power and phase mapping
Data Review
- Easy and fast review of digital EEG and MEG data files
- Fast paging, tagging and selected viewing of epochs of interest
- DSA and event displays for quick jump to relevant pages
- Additional selected and virtual artifact channels (EOG etc.)
- Pattern detection and averaging by spatio-temporal correlation
- Linear and non-linear correlation between scalp and source channels
- Spectral analysis: FFT, DSA, power and phase mapping
Handling of paradigms, events, and conditions
- Scripted paradigms for fast definition of triggers, conditions, epochs, filter settings etc.
- Import, export, and editing of event lists, triggers, and paradigms
- Design of complex conditions by logical expressions
- Creation of triggers from recorded signals, e.g. rectified EMG
Batch scripts for automated processing
- Fast and automated analysis of group studies using batch scripts
- Script functions for paradigm import
- Automated artifact scan with 2D graphical rejection tool
- Batch guided averaging within and across subjects
- User-defined combination of conditions (e.g. difference, average)
- Automated ERP peak detection and latency / apmlitude output
- Spatial and temporal data interpolation
- Batch commands for most source analysis functions
ERP Displays and Tools
- Topographic display and 3D whole-head mapping of averaged waveforms
- User definable layout with postscript export
- Overplot of multiple conditions
- Display of additional channels (polygraphic,intracranial, source, EEG, MEG)
- Event related (de)synchronisation: Display of ERD/ERS waveforms
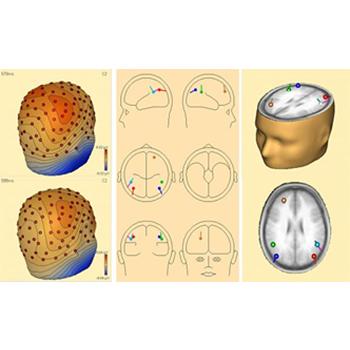
Source Localization
- Highly interactive graphical user interface for fast hypothesis testing
- Spatio-temporal multiple dipole and regional source modeling
- Image-weighted source fitting
- Tomographic source sensitivity display
- Automated multiple source probe scan (MSPS) for model validation
- (MSPS) for model validation
- Automated source fitting: RAP-MUSIC, Genetic algorithm
- PCA analysis with generation of spatial source components
- Realistic standardized FEM and multi-shell ellipsoidal head models
Source imaging
- 3D imaging of oscillatory activity using the multiple source beamformer (MSBF)
- Distributed volume images: LORETA, sLORETA, swLORETA, LAURA, SSLOFO
- Iterative and user-defined 3D imaging
- Minimum norm images based on the individual brain surface
- 3D movie of maps and dipoles using source waveforms
- Source activity projected onto standardized or individual MRI
Source import and export
- Direct transfer of source models between subjects and conditions
- Export of source models and source waveforms in ASCII
- Creation of source montages
- Coordinate systems: Talairach / Head / Device / Unit Sphere
- Batch commands for many source analysis functions
Time-frequency Analysis
- Time-frequency diagrams based on surface or source channels
- Display of absolute power or spectral amplitude
- Display of event-related spectral perturbation (ERD / ERS) in percent
- Temporal-spectral information optimized by complex demodulation
- Variable setting of time-frequency resolution
- Separation of evoked and induced activity by subtraction of the averaged evoked activity from single trials
- Direct comparison of two conditions
- 3D Imaging of oscillatory activity using the BESA Mulitple Source Beamformer (MSBF)
Source coherence
- Oscillatory coupling between brain regions analyzed directly in brain source space using source montages
- Calculation of cross-spectral matrices between any combination of source (and / or surface) channel
- Event-related coherence displayed in time-frequency space
- Coherence analysis based on power and phase locking
- Computation and display of phase delay and latency difference between channels
Statistical analysis
- Statistical probability maps based on resampling of the single trial data
- Statistics available for all time-frequency displays (absolute amplitude, TSE, coherence, comparison of conditions)
- Export of displayed data for offline statistics across subjects (e.g. in MATLAB)
System Requirements
- Pentium, 800 MHz or higher, 256 MB RAM (512 MB RAM with source coherence)
- Windows® 2000 or XP (Vista not supported yet)
- Graphics card supporting OpenGL 1.1 with 16 MB RAM or more
Certification
BESA has CE Certification